This report outlines trends in e-cigarette sales in the United States from February 2019 to December 2024.
The data has been revised based on regulatory actions taken by the U.S. Food and Drug Administration (FDA):
In February 2020, the FDA began prioritizing enforcement against flavored prefilled cartridges, except for tobacco and menthol flavors.
On September 9, 2021, the FDA began issuing marketing denial orders for flavored e-cigarette products.
As of April 1, 2022, the FDA gained regulatory authority over all nicotine-containing products, including synthetic nicotine.
1️⃣ Total Sales Continue to Grow
As of December 2024, there are 7,051 e-cigarette products on sale in the U.S.
93.4% of them are disposable e-cigarettes.
Monthly sales rose 32.1% from 15.7 million units in Feb 2020 to 20.7 million in Dec 2024.
Sales of non-tobacco flavored products increased by over 50%.
2️⃣ Rapid Growth of Disposable E-Cigarettes
Sales increased from 4.1 million units to 12.5 million units—a rise of 206.0%.
Market share increased from 26.1% to 60.3%.
By the end of 2024, 94.9% of disposable e-cigarettes were non-tobacco flavored.
3️⃣ Youth Usage Data (2024 National Youth Tobacco Survey, NYTS)
7.8% of high school students use e-cigarettes (~1.21 million individuals).
3.5% of middle school students use e-cigarettes (~410,000 individuals).
Among current users, 87.6% use flavored products.
55.6% use disposable e-cigarettes; 15.1% use menthol-flavored products.
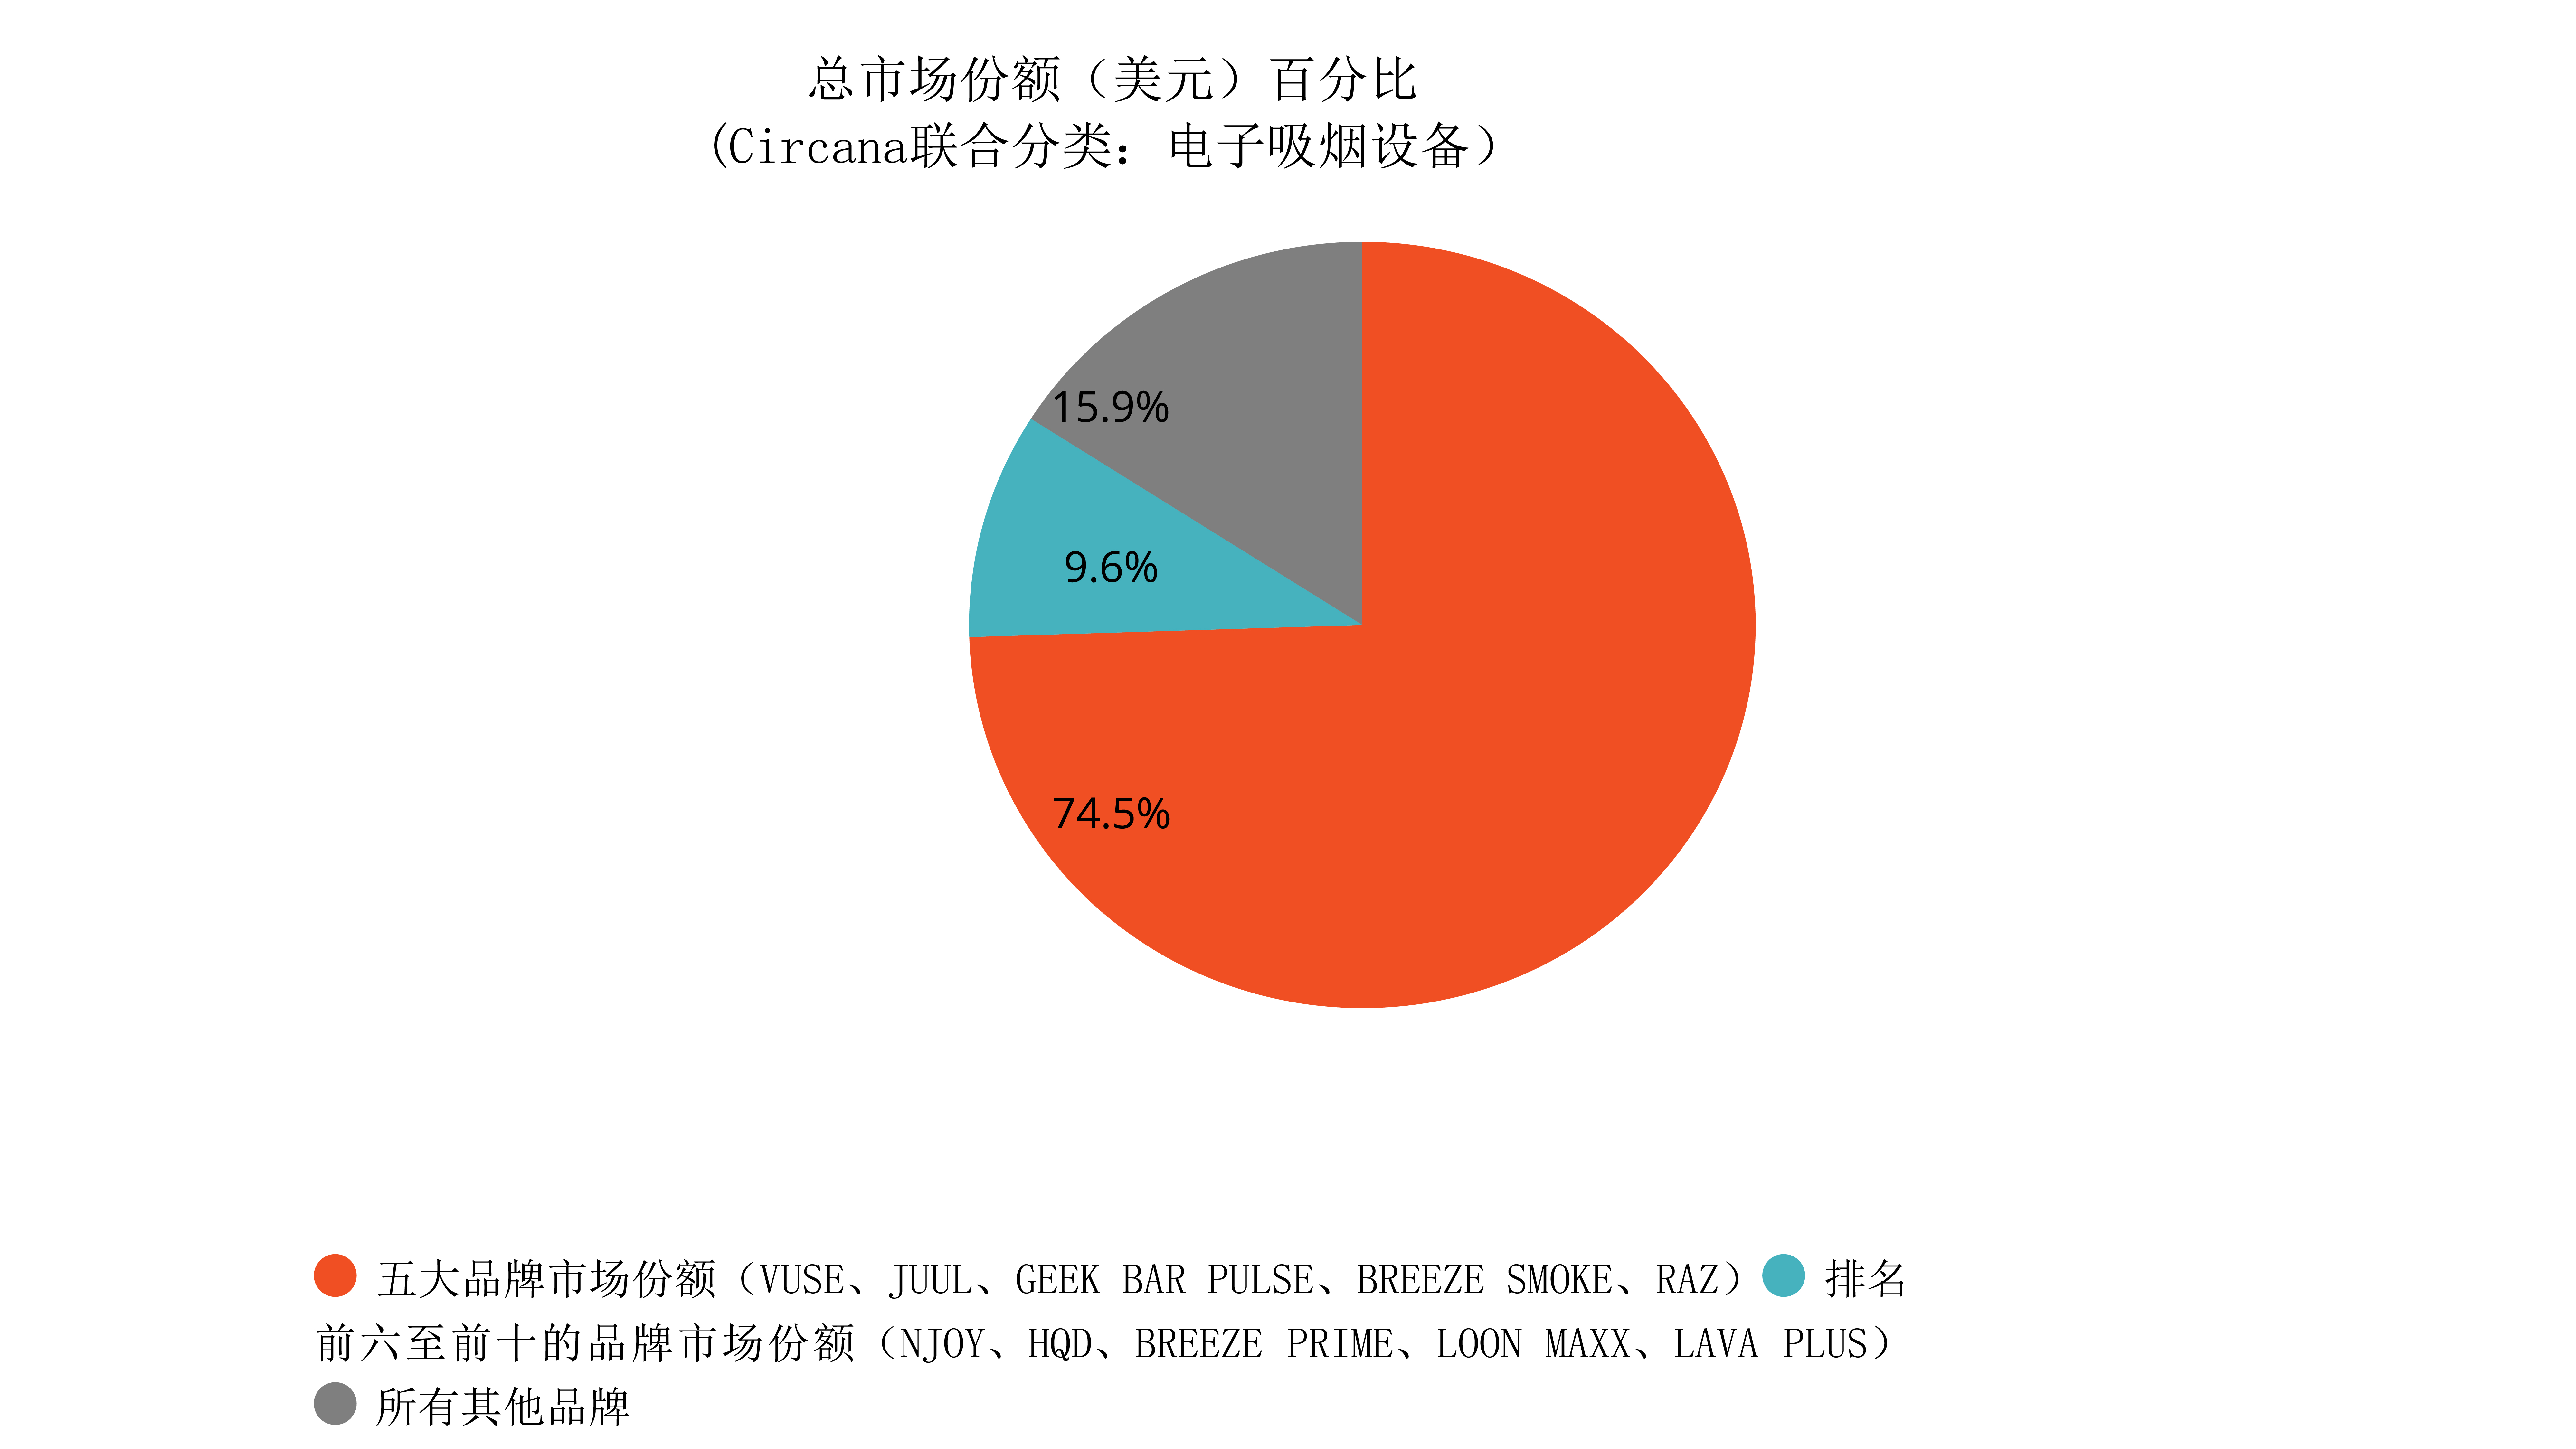
4️⃣ Popular Brand Trends
Leading brands include RAZ, Juul, Geek Bar Pulse, Breeze Smoke, HD, Breeze Prime, Loon Maxx, Laya Plus.
The top 5 brands account for 74.5% of total sales; the top 10 brands account for 84%.
Geek Bar Pulse and RAZ are categorized as "smart vapes," equipped with digital displays, usage alerts, and battery indicators.
The EVALI outbreak (E-cigarette or Vaping Product Use-Associated Lung Injury) at the end of 2019 and the COVID-19 pandemic influenced market trends.
New nicotine-containing products continue to emerge, such as flavored cigars and nicotine pouches.
Small and discreet products (e.g., Pebble Clear) have drawn regulatory attention and are classified as "cooling/enticing vapes."
A comprehensive ban on all non-tobacco flavored e-cigarette products—including disposable and cartridge-based formats—is considered an effective measure to reduce youth usage.
The sales data in this report excludes vape shops and online retailers. Only physical retail channels (e.g., convenience stores, supermarkets) are included.
Devices and accessories without nicotine were excluded (accounting for only 2.5% of sales in 2024).
To standardize comparisons, a "unit" is defined as:
one disposable e-cigarette,
or one bottle of e-liquid,
or five prefilled cartridges.
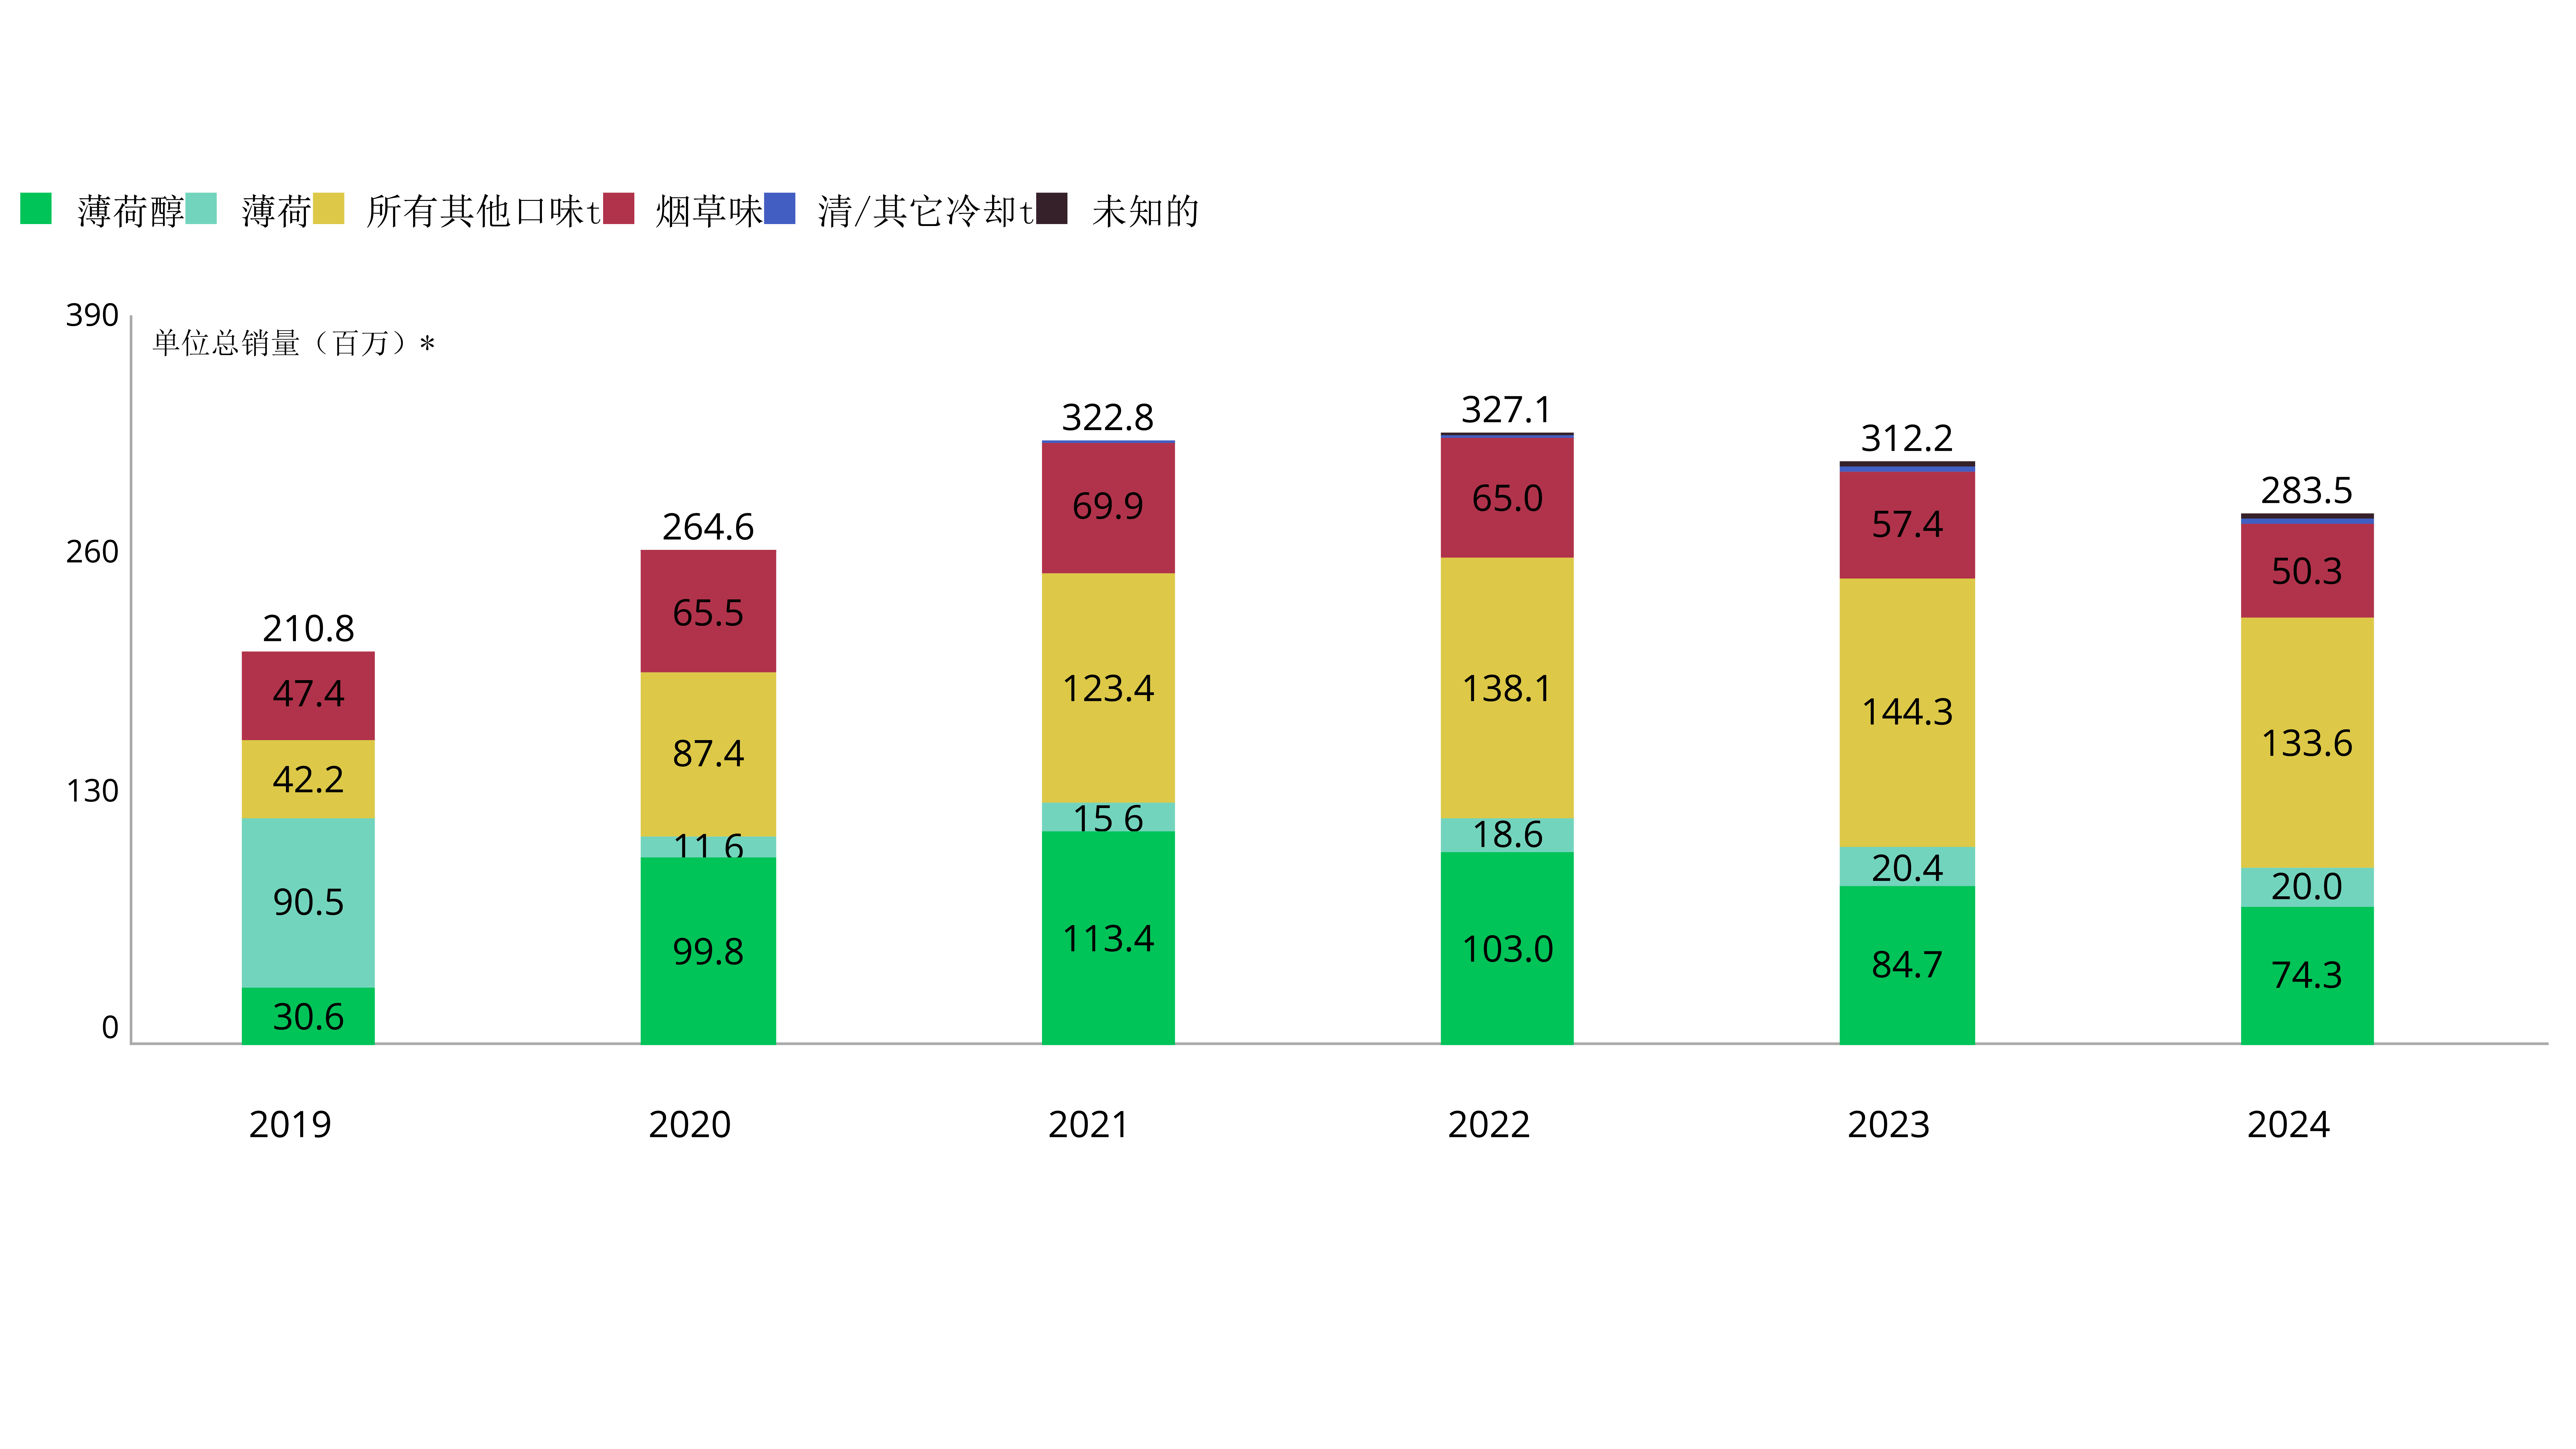
From Feb 2020 to Dec 2024, monthly U.S. e-cigarette sales rose from 15.7M to 20.7M units (+32.1%).
Tobacco-flavored e-cigarette sales dropped from 4.4M to 3.6M units, with market share falling from 28.3% to 17.6%.
Non-tobacco flavors grew from 11.2M to 16.9M units (+50.1%), capturing 81.5% market share.
Menthol and mint flavors rose slightly in volume but lost some share.
The biggest gains came from “Other Flavors” (e.g., fruit, beverages, candy, desserts), which doubled from 4.6M to 9.8M units (29.6% to 47.2% share).
"Cooling/transparent" flavors (labeled as "ice," "cool," or "clear")—often containing synthetic cooling agents like WS-23—grew 182% in two years, with share increasing from 0.8% to 1.1%.
Due to local flavor restrictions, California saw the most significant sales decline nationwide.
From Dec 2022 to Dec 2024, monthly sales dropped from 831,700 to 421,500 units (-49.3%).
This accounted for 12.7% of the national volume decline during the same period.
The report is based on a study commissioned by the CDC Foundation and funded by Bloomberg Philanthropies.
Retail tracking was conducted via Circana (formerly IRI), covering over 95.5% of total retail sales using a standardized coding system that prioritizes high-selling and newly introduced products.
Sales Scope:
Excludes vape shops and online retailers
Covers physical stores (e.g., gas stations, convenience stores)
Non-nicotine devices excluded (2.5% of 2024 sales)
Flavor Categories:
Sweet: fruits, spices, chocolates
Alcohol: rum, brandy, cocktails
Candy/Desserts
Cooling/Clear: labeled “ice,” “cool,” “clear,” typically with WS-23 (e.g., BC5000 Clear)
Revenue Trends (Feb 2020–Dec 2024):
Monthly revenue increased from $320.5M to $480.5M (+49.9%)
Tobacco: $100.4M → $98.3M (-2.1%), share fell from 31.3% to 20.4%
Non-tobacco: $220.1M → $378.3M (+71.9%), share up to 78.7%
Menthol: $116.1M → $165.9M (+42.9%), share slightly down to 34.5%
Mint: $31.2M → $25.8M (-17.3%), share dropped to 5.4%
Other flavors: $72.7M → $183.4M (+152.3%), share rose to 38.2%
Sales vs. Revenue Difference:
Revenue grew even as unit sales declined for some flavors—likely due to inflation and higher-priced large-capacity disposables.
Excludes online and vape store sales; based on 4-week rolling data.
Devices without nicotine excluded (9.5% in 2022).
Prefilled devices: dropped from 11.6M to 8.2M units (-29.1%), market share from 73.9% to 39.7%
Disposables: rose from 4.1M to 12.5M units (+206%), market share from 26% to 60.3%
Disposables became the mainstream due to affordability, portability, and flavor variety.
Disposables' unit share: 26% → 60.3%
Prefilled devices' unit share: 73.9% → 39.7%
Excludes vape shops and online channels; accessories excluded (25% of 2023 total).
Top brands (Nov 3 – Dec 29, 2024):
Top 5: VUSE, JUUL, GEEK BAR PULSE, BREEZE SMOKE, RAZ
6–10: NJOY, HQD, BREEZE PRIME, LOON MAXX, LAVA PLUS
Top 5 brands accounted for 74.5% of total revenue; top 10 brands combined made up 84.1%.
This report is compiled using publicly available data from the CDC Foundation and related authoritative institutions. It is intended solely for industry reference and informational purposes.
The original copyrights belong to the respective organizations. Unauthorized reproduction or commercial use is prohibited.
This content does not constitute investment, sales, or legal advice. The author and publishing platform bear no responsibility for any direct or indirect losses resulting from the use of this information.

Phone: +86-755-23502117
Email: marketing@ipurejuice.com


